|

 CTD stands for conductivity, temperature and pressure (depth)
of the seawater. A CTD chain consists of many CTD probes aligned on a
cable, which by inductive coupling provides the power for the sensor
electronics and the data transfer between underwater sensors and deck
unit.
CTD stands for conductivity, temperature and pressure (depth)
of the seawater. A CTD chain consists of many CTD probes aligned on a
cable, which by inductive coupling provides the power for the sensor
electronics and the data transfer between underwater sensors and deck
unit.
Each sensor fin is an autonomous CTD device with a
platinum thermometer, a seven-pole conductivity cell and a
piezoresistive pressure transducer. Voltages are multiplexed and digitized
by a 16-bit analog to digital converter. The conversion rate is 20 cycles
per second. Data can be internally low pass filtered for adjustment to the
rate of external polls, typically every two seconds.
Parameter
|
Temperature |
Conductivity |
Pressure |
| Range | -2 to 30 °C | 0 to 60 mS/cm | 0 to 600 dBar |
| Resolution | 0.0007 °C | 0.001 mS/cm | 0.02 dBar |
| Accuracy | 0.005 °C | 0.01 mS/cm | 0.6 dBar |
The vertical resolution of the acquired two-dimensional property fields is
defined by the distance between sensor fins. A CTD chain can be
configured with arbitrary sensor positions. The most appropriate
spacing depends on the oceanographic situation. Typical sensor
distances are between 1 and 10 metres. Several tens of sensor fins
are required for a good representation of two-dimensional property
fields. The theoretical upper limit of 254 underwater packages is
caused by their unique 8 bit addresses.
The horizontal
resolution of a towed CTD chain is the product of the towing speed and
the duration of a polling cycle, which is typically two seconds. The
maximum towing speed must be adjusted to the breaking strength of the
towing cable. The drag of a towed CTD chain system increases with the
speed of the towing vessel, with the length of the cable, and with the
efficiency of the depressor at its tail. Speeds in excess of 8 knots (4
m/s) do not challenge the sensors, they are however only recommended
for very short chains (<25 m) or for long chains with weak and quite
inefficient depressors. Realistic tow speeds for chains up to 200 m
long are between 4 and 6 knots (2 to 3 m/s). Hence the typical
horizontal resolution becomes 5 metres.
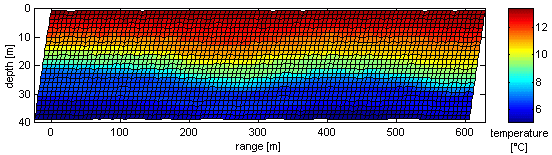
The data example above was taken from an acquisition in Massachusetts Bay
in June. 200 seconds (100 records) from a long section are shown. Due
to limited water depth only the lower 25 sensor fins of the CTD chain
were deployed into the water, while the remaining 15 fins were still on
deck and measured in air (data discarded). Each tile in the image represents one
data point. The records appear slanted in accordance with the spatial
lag of lower sensors in relation to the stern of the towing ship.
Internal waves appearing in the records were produced further out at
the shelf break by interaction of tidal currents with topography. While
temperature is displayed above, salinity and density sections (not
shown) look almost the same in this case because of a fixed T-S
relation where the warmer surface water has lower salinity.
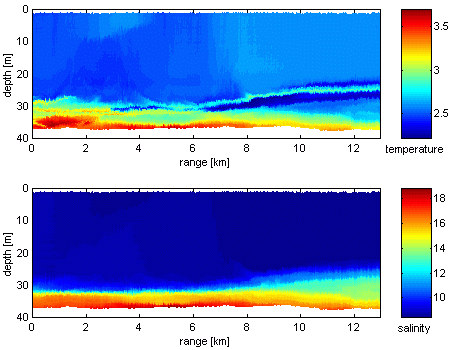 Another shallow water example was obtained from a CTD chain configured with 81 sensor fins.
It took 90 minutes to run the distance of 13 km. A pixel
width in the image on the left represents 15 seconds, while original
data were acquired every 2 seconds. In contrast to the example from
Mass Bay the T-S relation in the records from the Baltic Sea in
February is not a monotonic function. See for instance the temperature
structure in the halocline. A comprehensive description of the oceanographic
situation is found in the article of J. Sellschopp et al., Direct observations
of a medium-intensity inflow into the Baltic Sea,
Continental Shelf Research 26, pp. 2393-2414 (2006).
Another shallow water example was obtained from a CTD chain configured with 81 sensor fins.
It took 90 minutes to run the distance of 13 km. A pixel
width in the image on the left represents 15 seconds, while original
data were acquired every 2 seconds. In contrast to the example from
Mass Bay the T-S relation in the records from the Baltic Sea in
February is not a monotonic function. See for instance the temperature
structure in the halocline. A comprehensive description of the oceanographic
situation is found in the article of J. Sellschopp et al., Direct observations
of a medium-intensity inflow into the Baltic Sea,
Continental Shelf Research 26, pp. 2393-2414 (2006).
13-Dec-2013 js
|